Side projects (AI/ML & creative coding)
Outside of design, I enjoy using code as a medium for creative expression and experimentation, often taking a playful approach, using tools in unconventional ways. Below are some of my favorite projects since 2018.
Study with Me, 2018
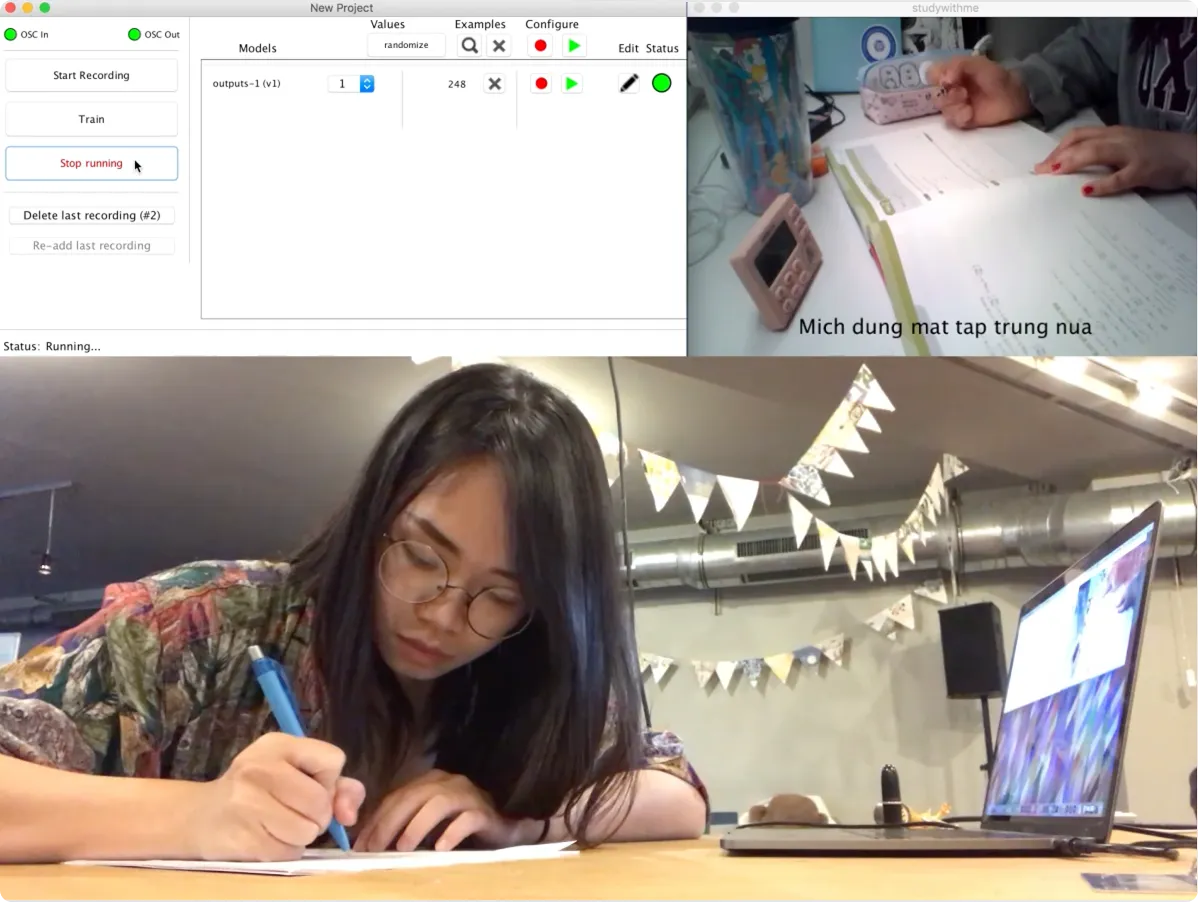
I made this app for my sister to help her stay focused during exam season. Inspired by the ‘Study With Me’ video series on YouTube, the application plays a 1-hour video of someone quietly studying. It can detect when my sister look away, and will nag her whenever she gets distracted.
Tools
Wekinator, Processing, OpenCV
Audio transcripts (Vietnamese to English):
- Mích, học bài đi Mích, back to study
- Mích đừng mất tập trung nữa Mích, stop losing focus
- Học đi cho mẹ vui Mích, study and make your mom happy
- Mích đang nghĩ gì đấy? Mích, what are you doing?
- Đã bảo rồi đừng có mất tập trung nữa I told you so, focus!
Art-DCGAN, 2018
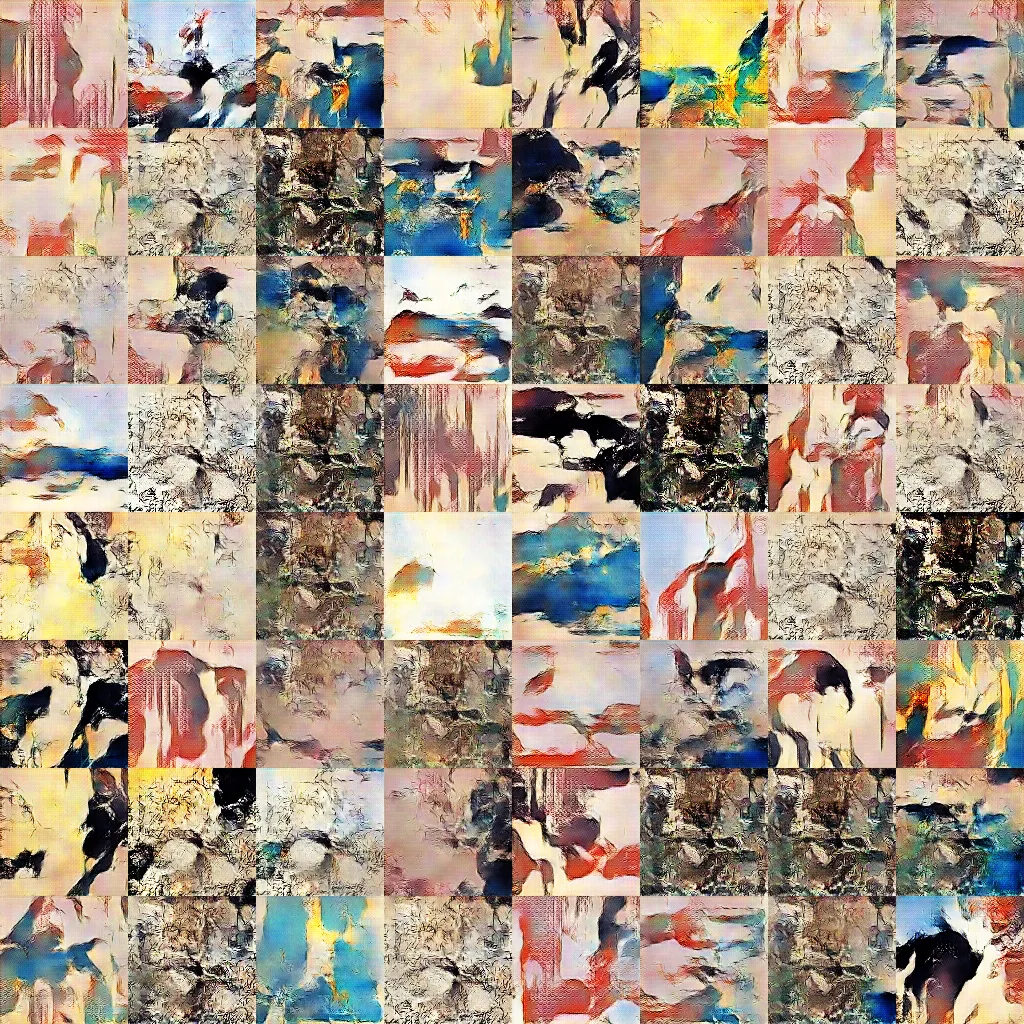
Using Robbie Barrat’s art-DCGAN, a modified implementation of DCGAN focused on generative art, I trained my own model on a dataset of 1,700 Ukiyo-e paintings scraped from Wikiart.
People with My Name, 2018
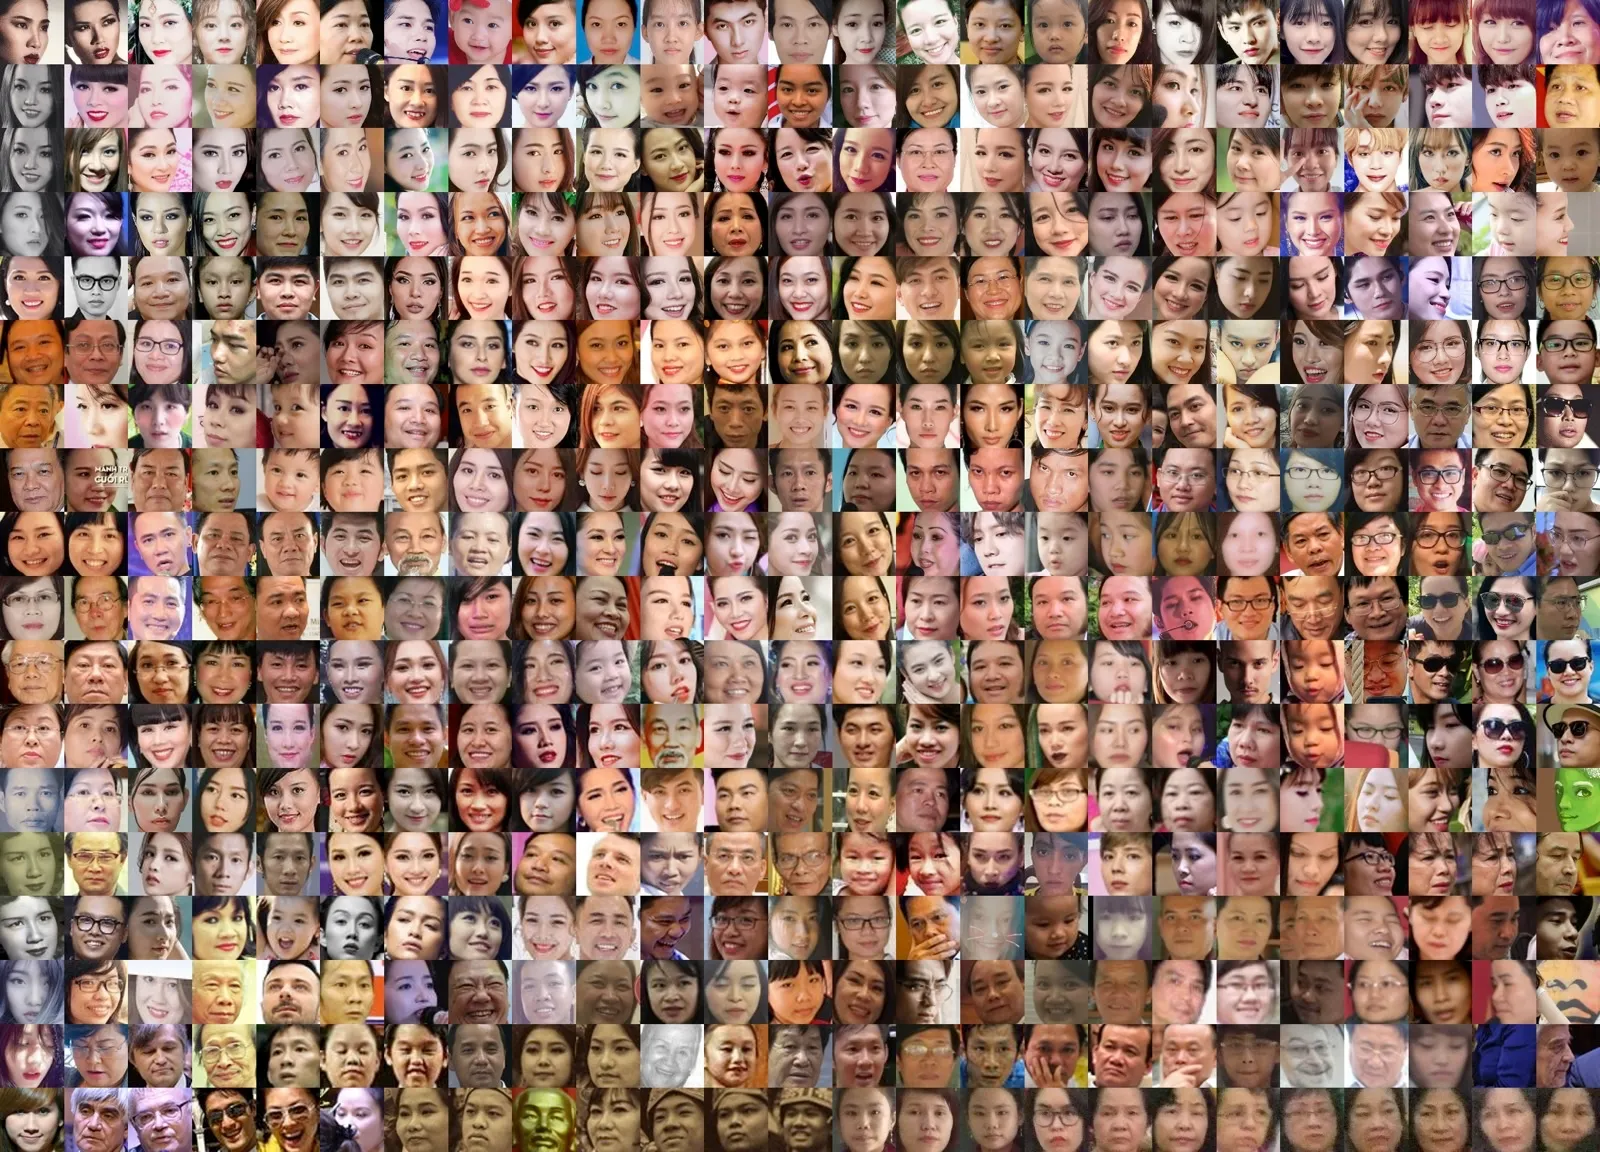
I google-searched my full name and scraped the first 500 image results. From those, I cropped out faces and used t-SNE for dimensionality reduction to cluster similar images. It’s worth noting that Trang Nguyen is a fairly common Vietnamese name. I made this with Aarón Montoya-Moraga’s Google Images scraping tool and Andreas Refsgaard’s face-cropping Processing tool.
Tools
Processing, t-SNE
Git Song, 2018
I turned my GitHub contribution graph into music. As time moves forward, notes play to represent daily contributions; the more contributions, the higher and louder the note. The data is mapped across 3 octaves, starting from octave 4.
Tools
Sonic Pi
Audio Reactive Visuals, 2018
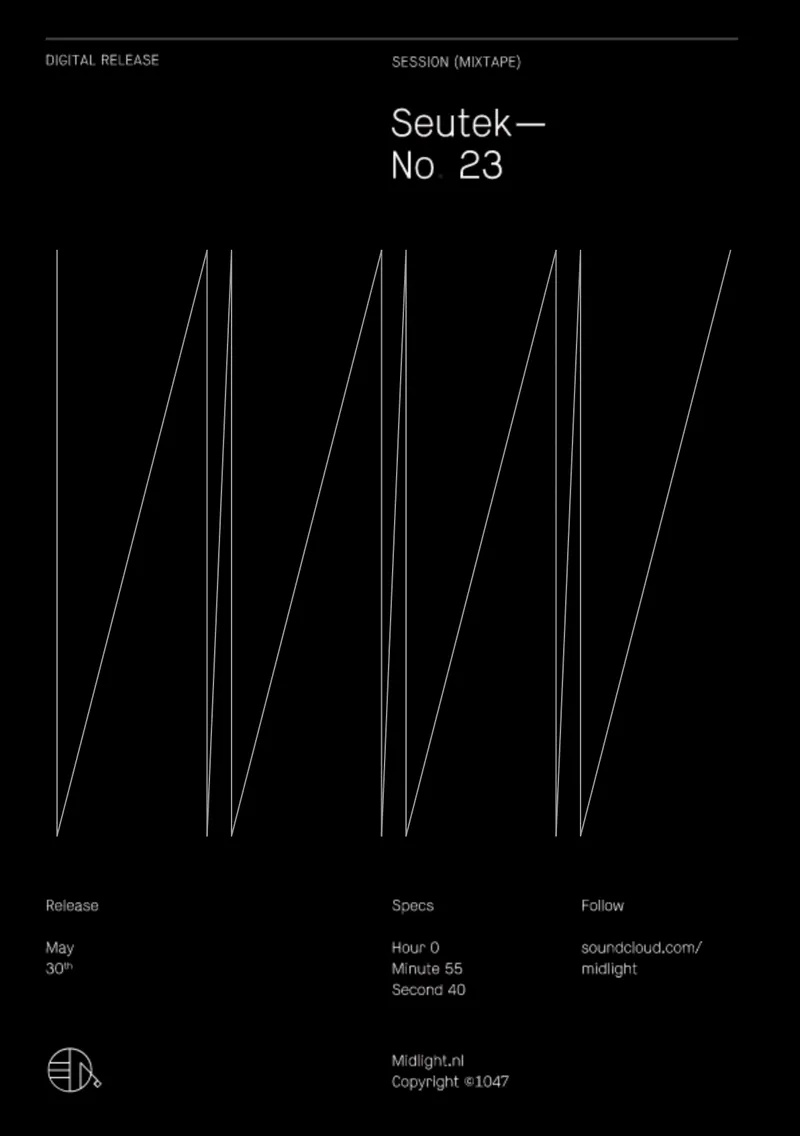
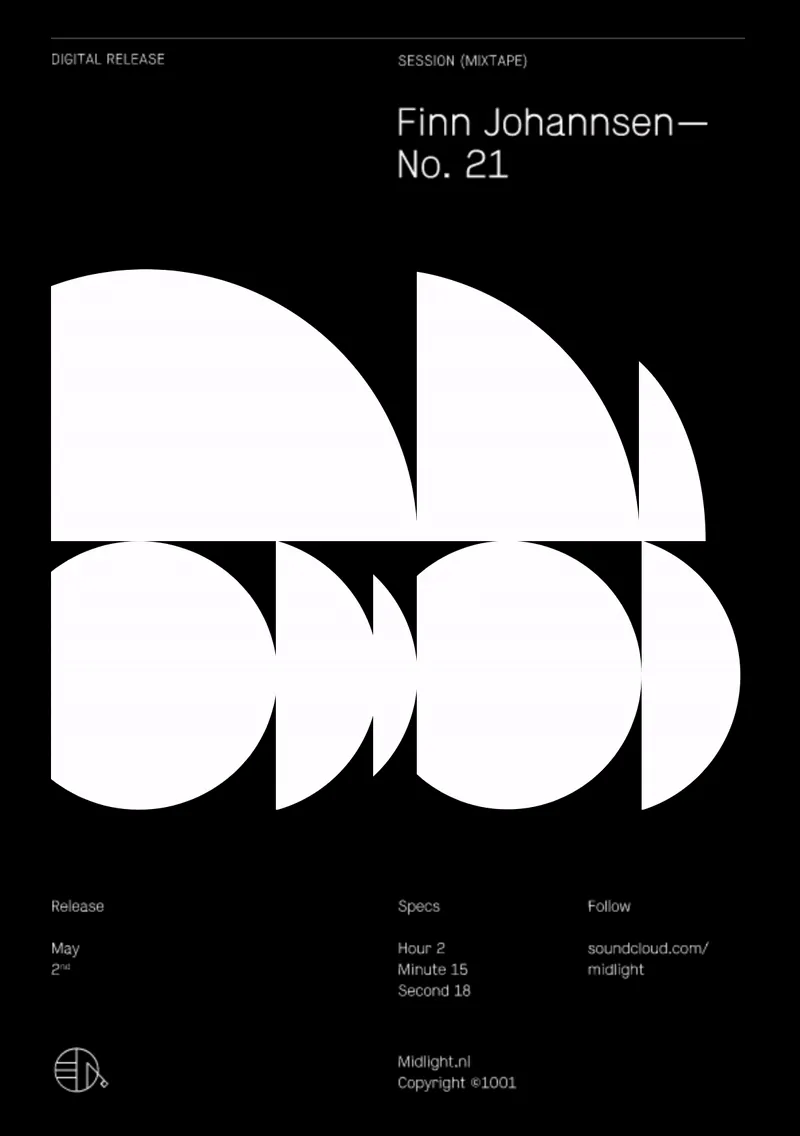
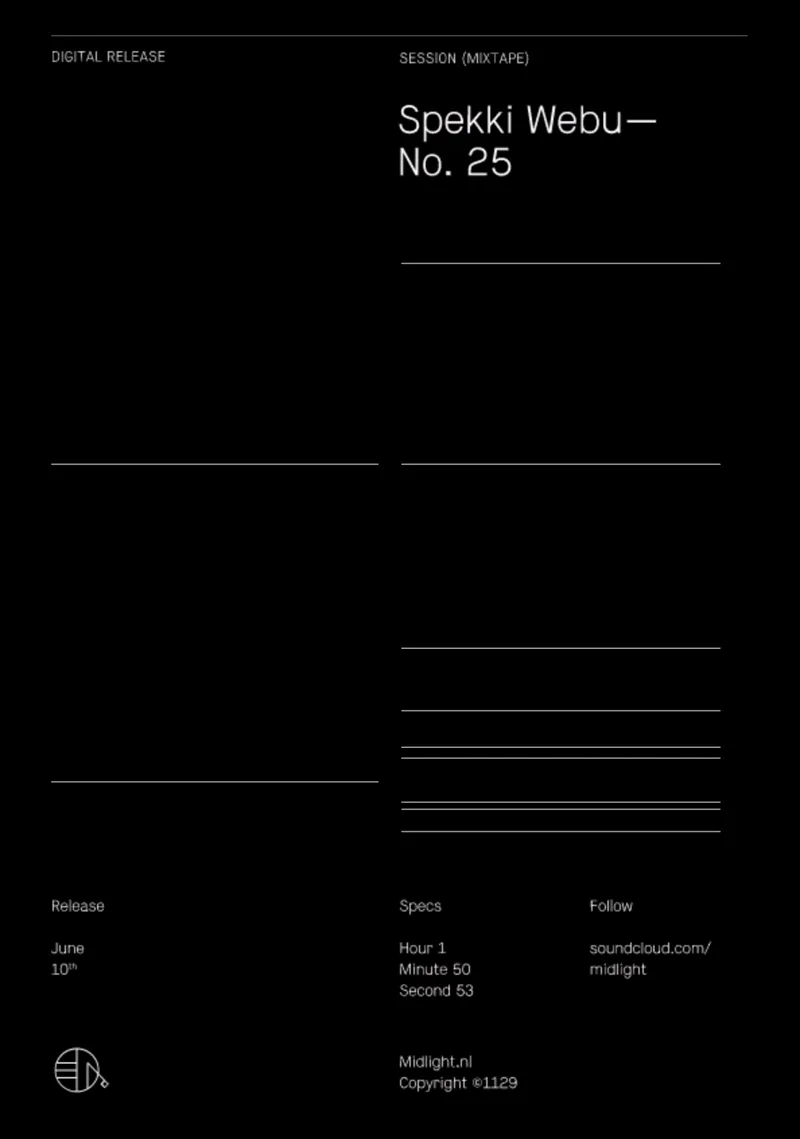
A series of audio-reactive posters I created for Midlight using Processing. The original static visuals were designed by Studio Naam.
Tools
Processing
Spark AR filters, 2018
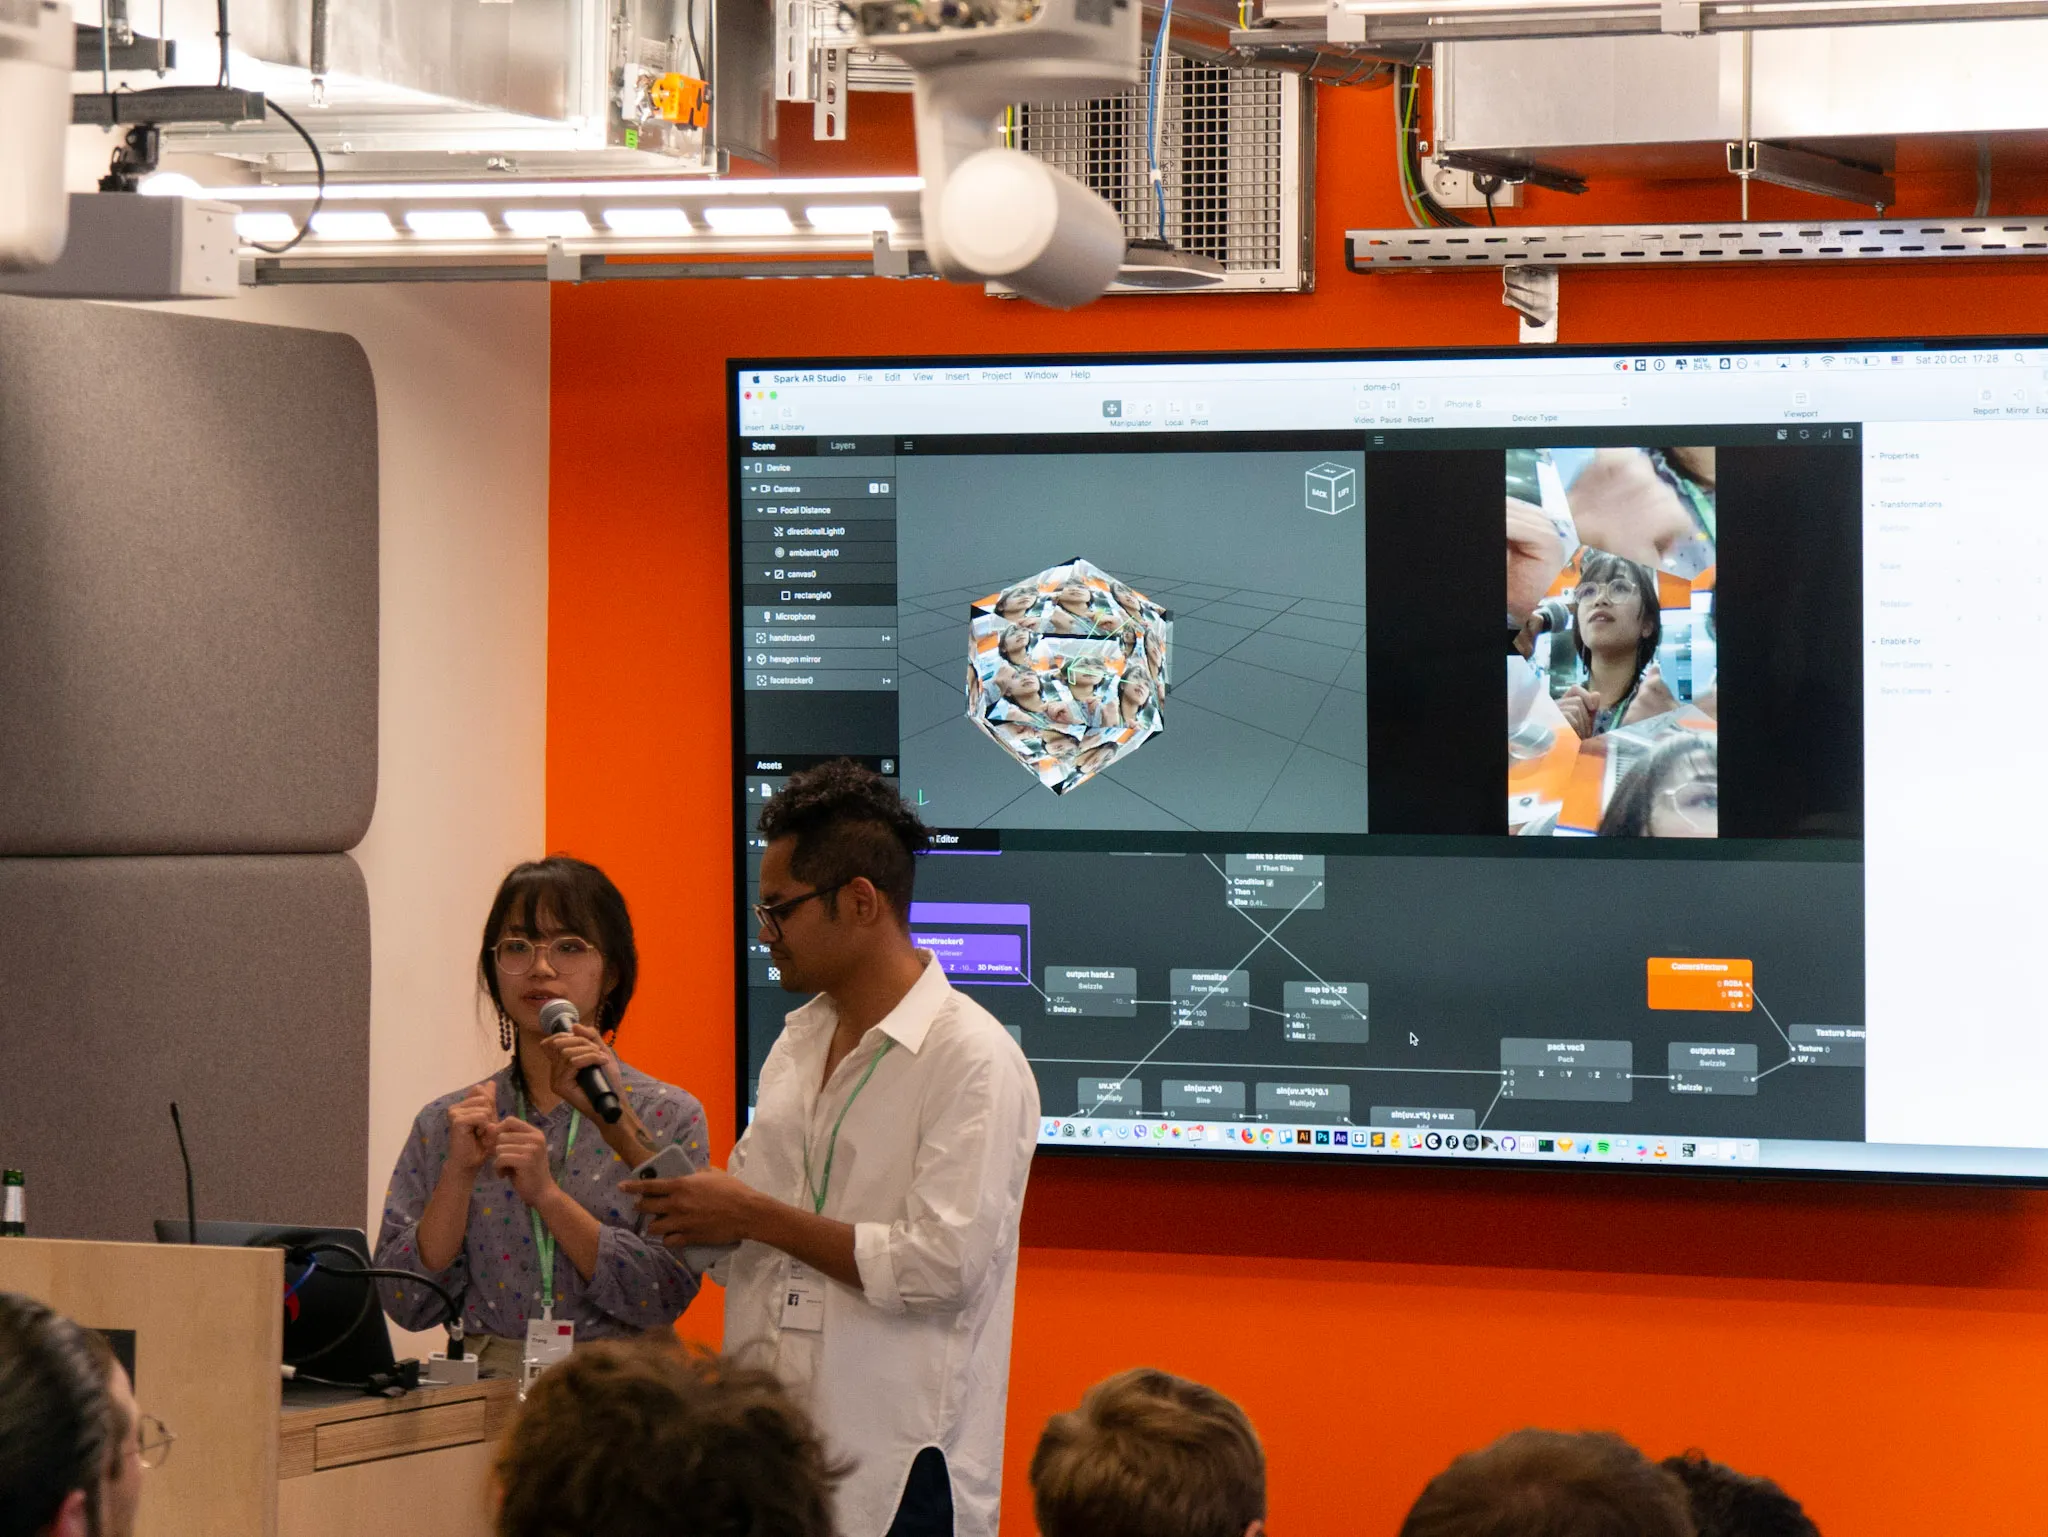
A filter I developed in Spark AR as part of the Meta’s Spark AR Hackathon Berlin in 2018.
Tools
Spark AR
AV Performance, 2019
In 2019, I took a 2-month VJ course using Resolume, and as part of the graduation show, I performed a live AV show at Public Art Lab.
Tools
Resolume
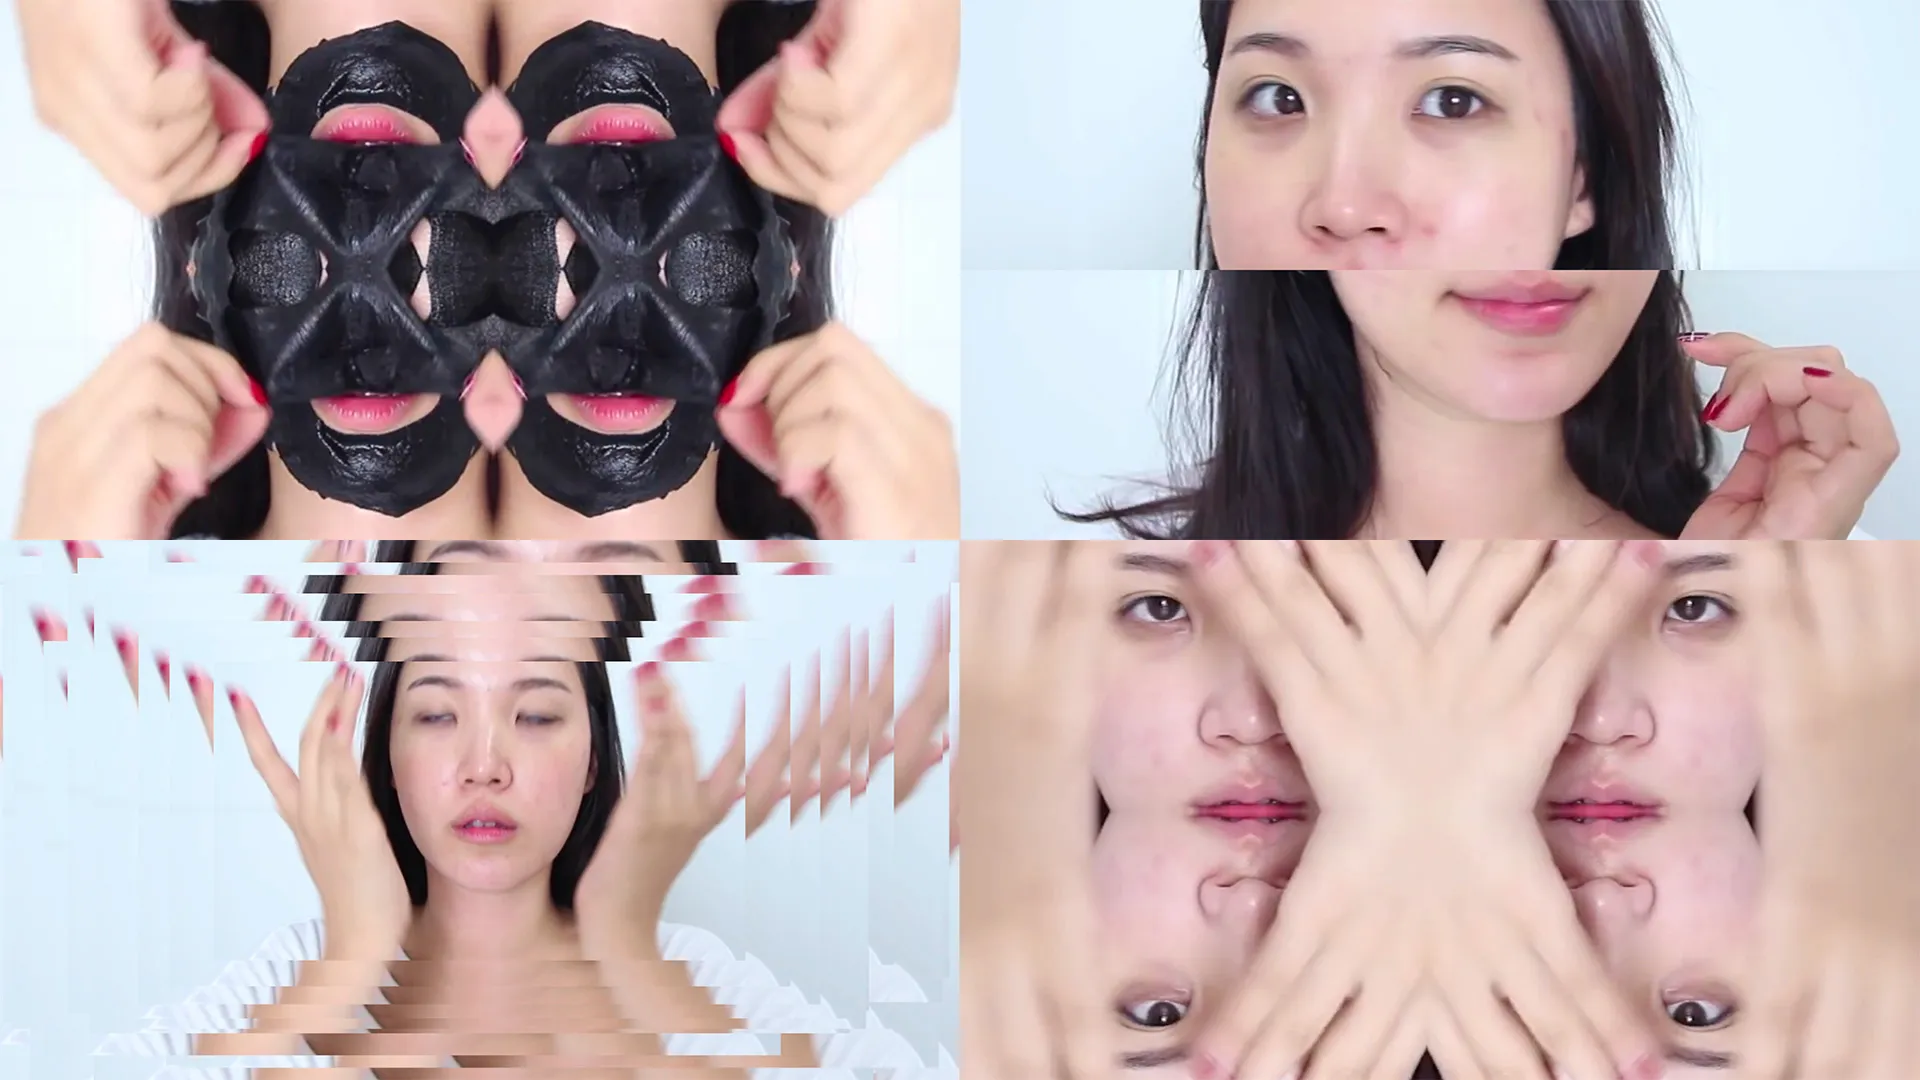
P5.js PoseNet as MIDI Controller, 2020
Control Ableton Live with your hands. Built with PoseNet, a machine learning model that enables real-time human pose estimation by detecting key points on the body and face. See demo video.
Tool
Ableton Live, PoseNet
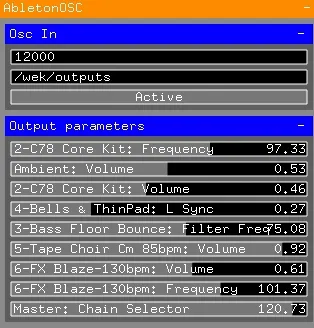
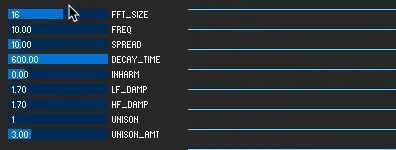
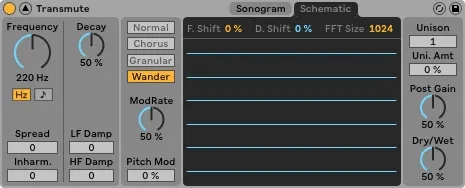
Visualisation for Spectral Resonator, 2022
An alternative visualisation I built for Spectral Resonator.
Tools
Processing
Datadog Hello Kitty Theme, 2024
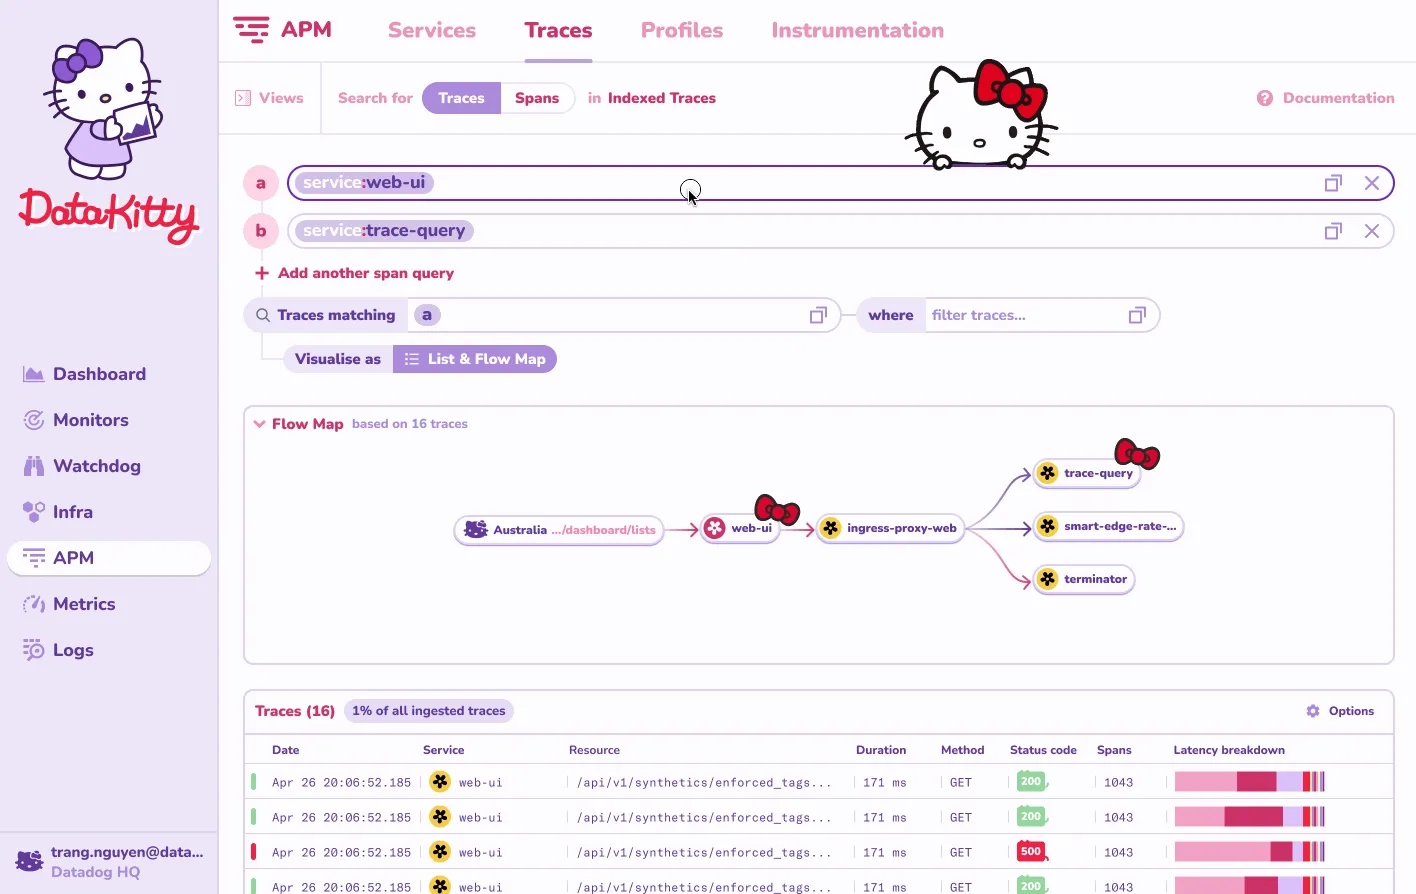
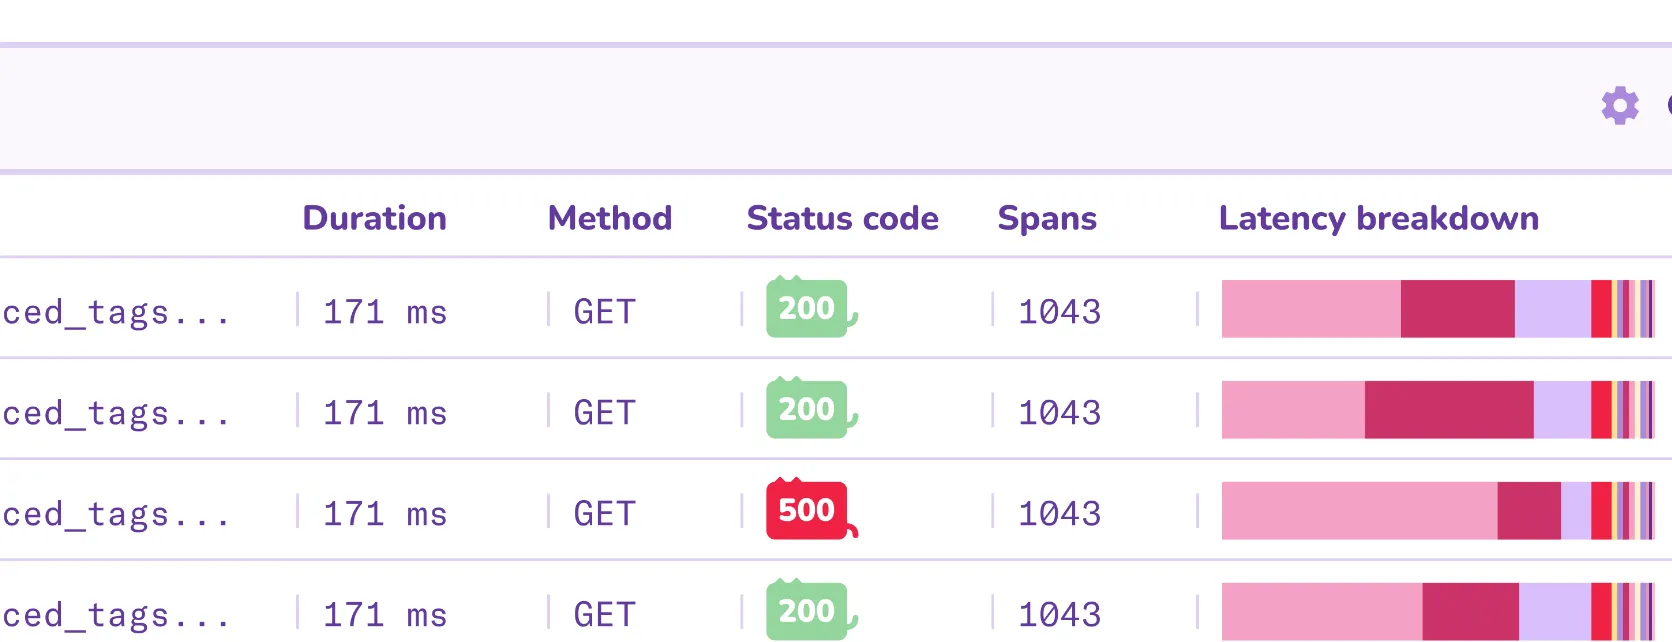
Wanting a refreshing departure from Datadog’s traditional utilitarian look and feel, I gave the UI a makeover. This Hello Kitty theme introduced a soft pastel color palette, rounded corners and playful animations everywhere!
Tools
Figma, Giphy
Bufo Emoji Generator, 2025
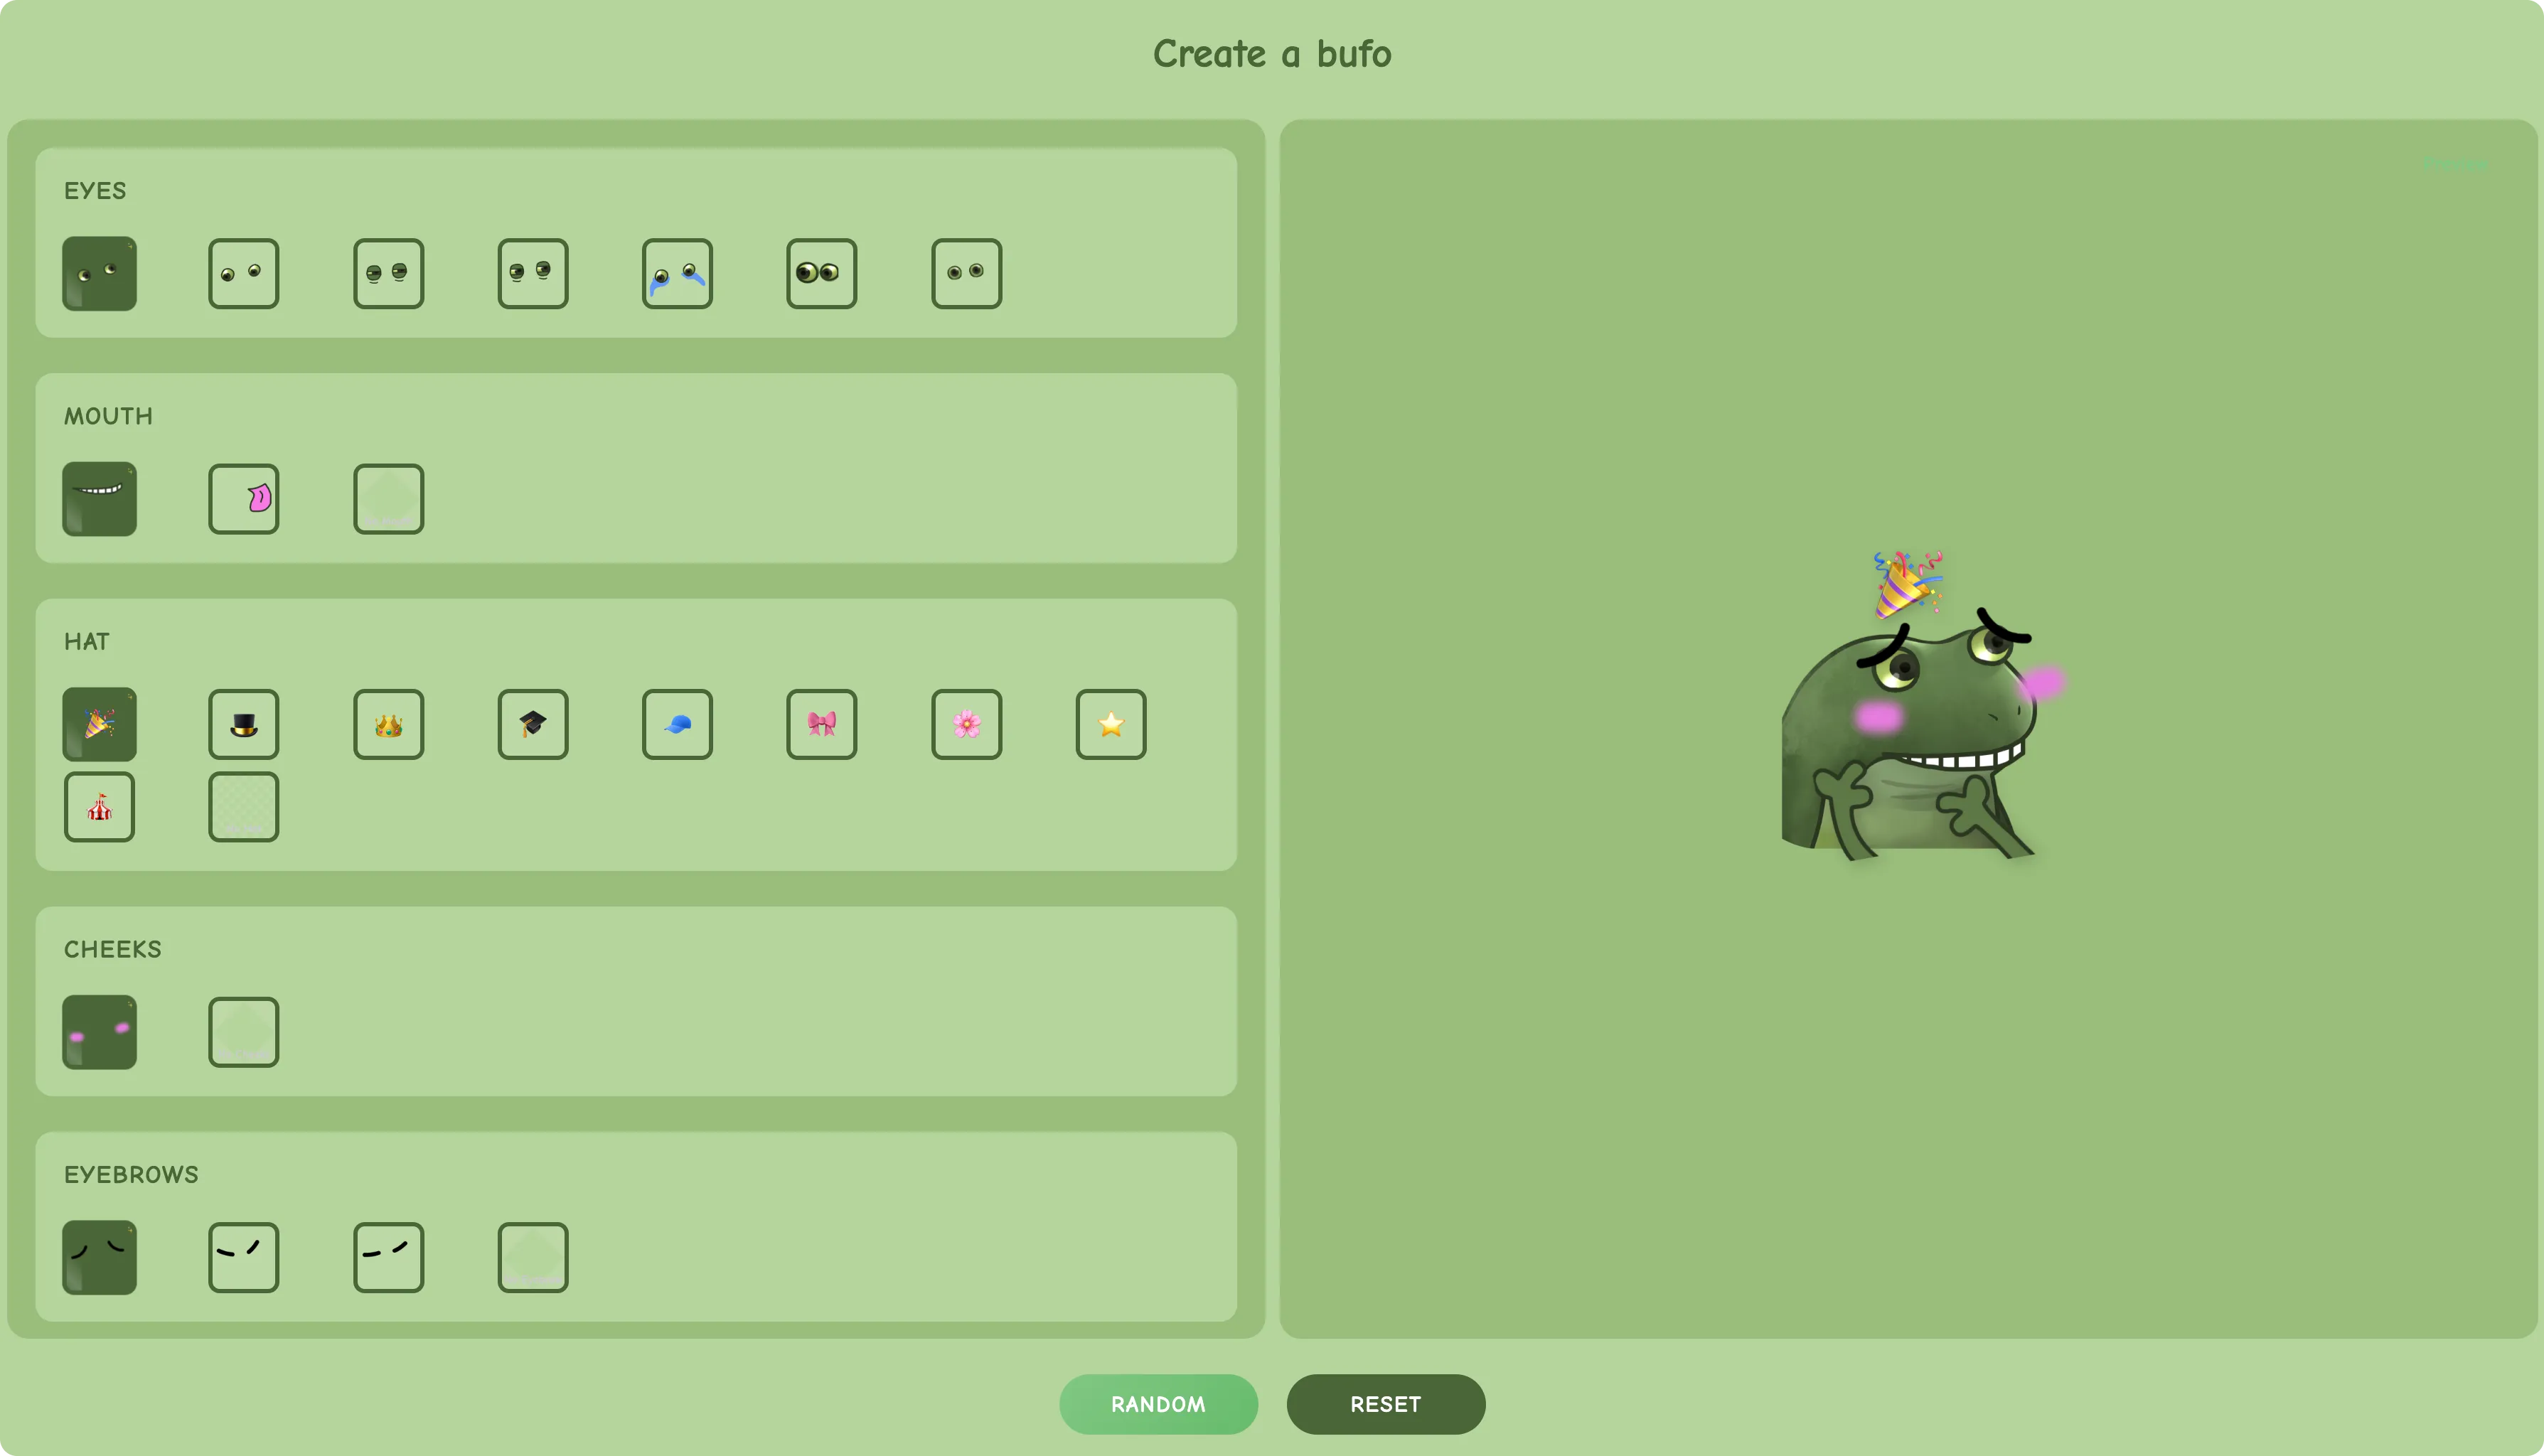
A fun little website I built for generating custom Bufo Slack emojis. I manually created the assets and vibe-coded this in Cursor over a couple of days. Check it out.
Tools
Figma, Cursor
Animating scatterplots with Vega-Lite, 2025
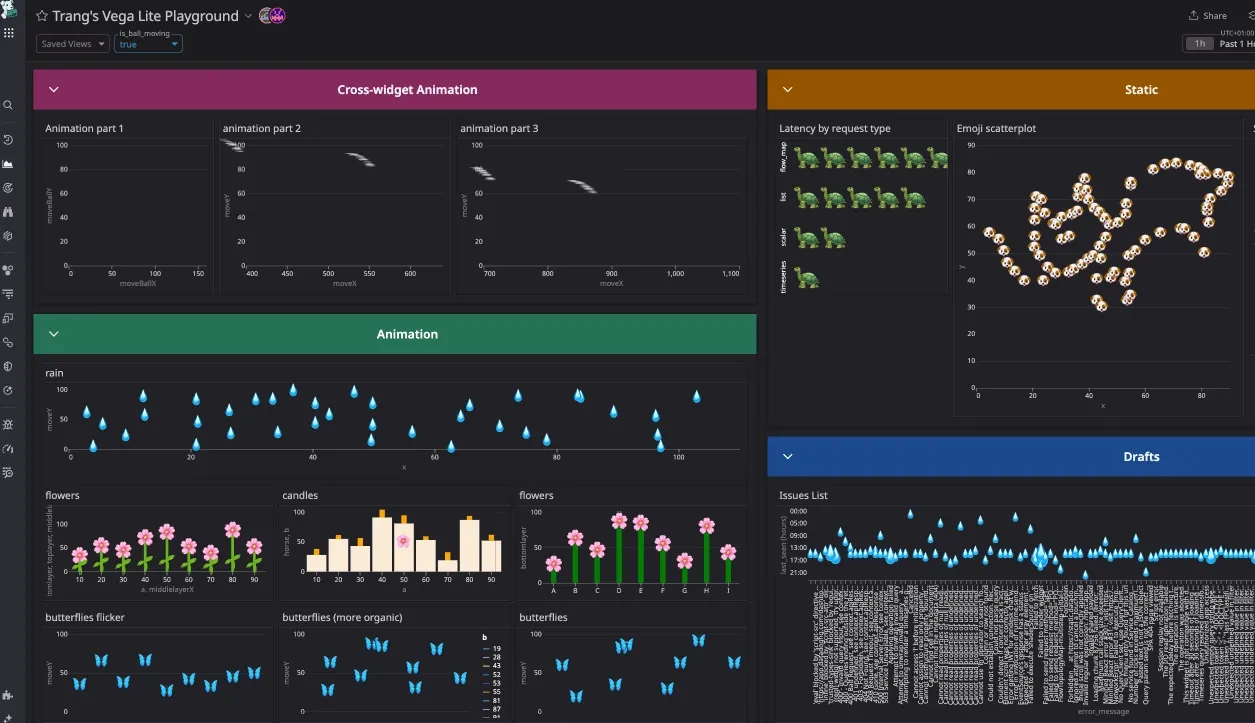
Data visualisations created when Datadog rolled out the support for Vega-Lite. An open-source visualization grammar that allows allows users to create graphs that are not available within the native Datadog widget and query system.
Tools
Vega-Lite
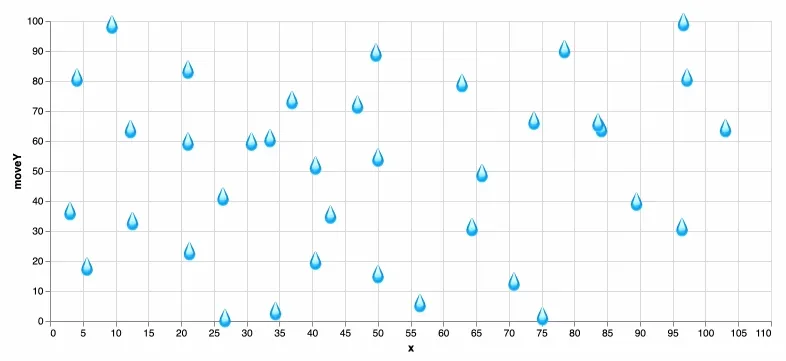
The first animation I created was this scatterplot of falling raindrops, using a simple dataset with about 40 points.Each point is represented with a 💧 emoji using Vega-Lite’s text mark.
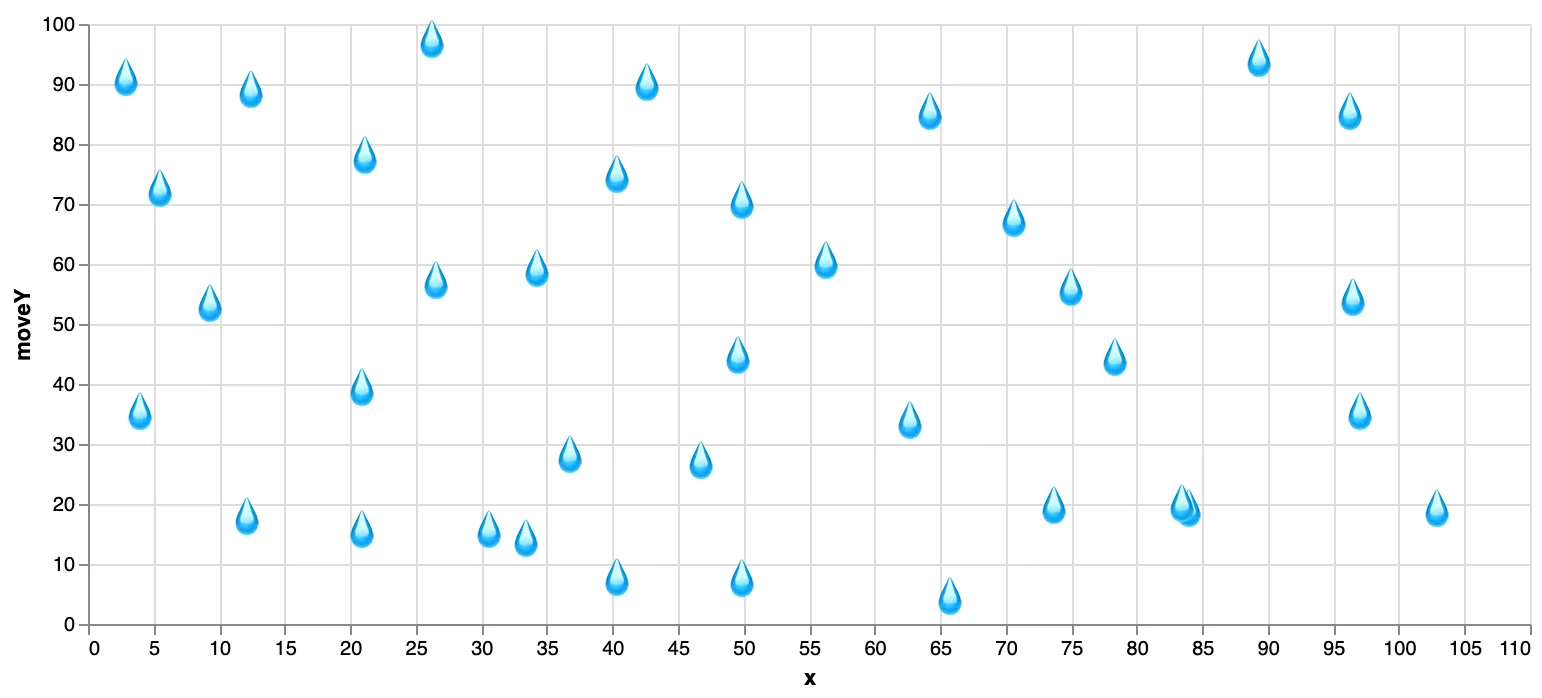
To make the raindrops “fall”, I added a timer. It updates every 10ms and is the time that passed since the visualization loaded.
{
  "name": "time",
     "on": [{"events": {"type": "timer", "throttle": 10}, "update": "now()"}]
}
Using this timer, I updated the Y position of each raindrop with a combination of modulo (%) and sine to create looping vertical movement with some variation in speed:
"transform": [
    {
      "calculate": "100 + (datum.y - time/100) % 100 + sin(datum.y * time/10000)",
      "as": "moveY"
    }
  ]
And voilà, animated rain. View code.
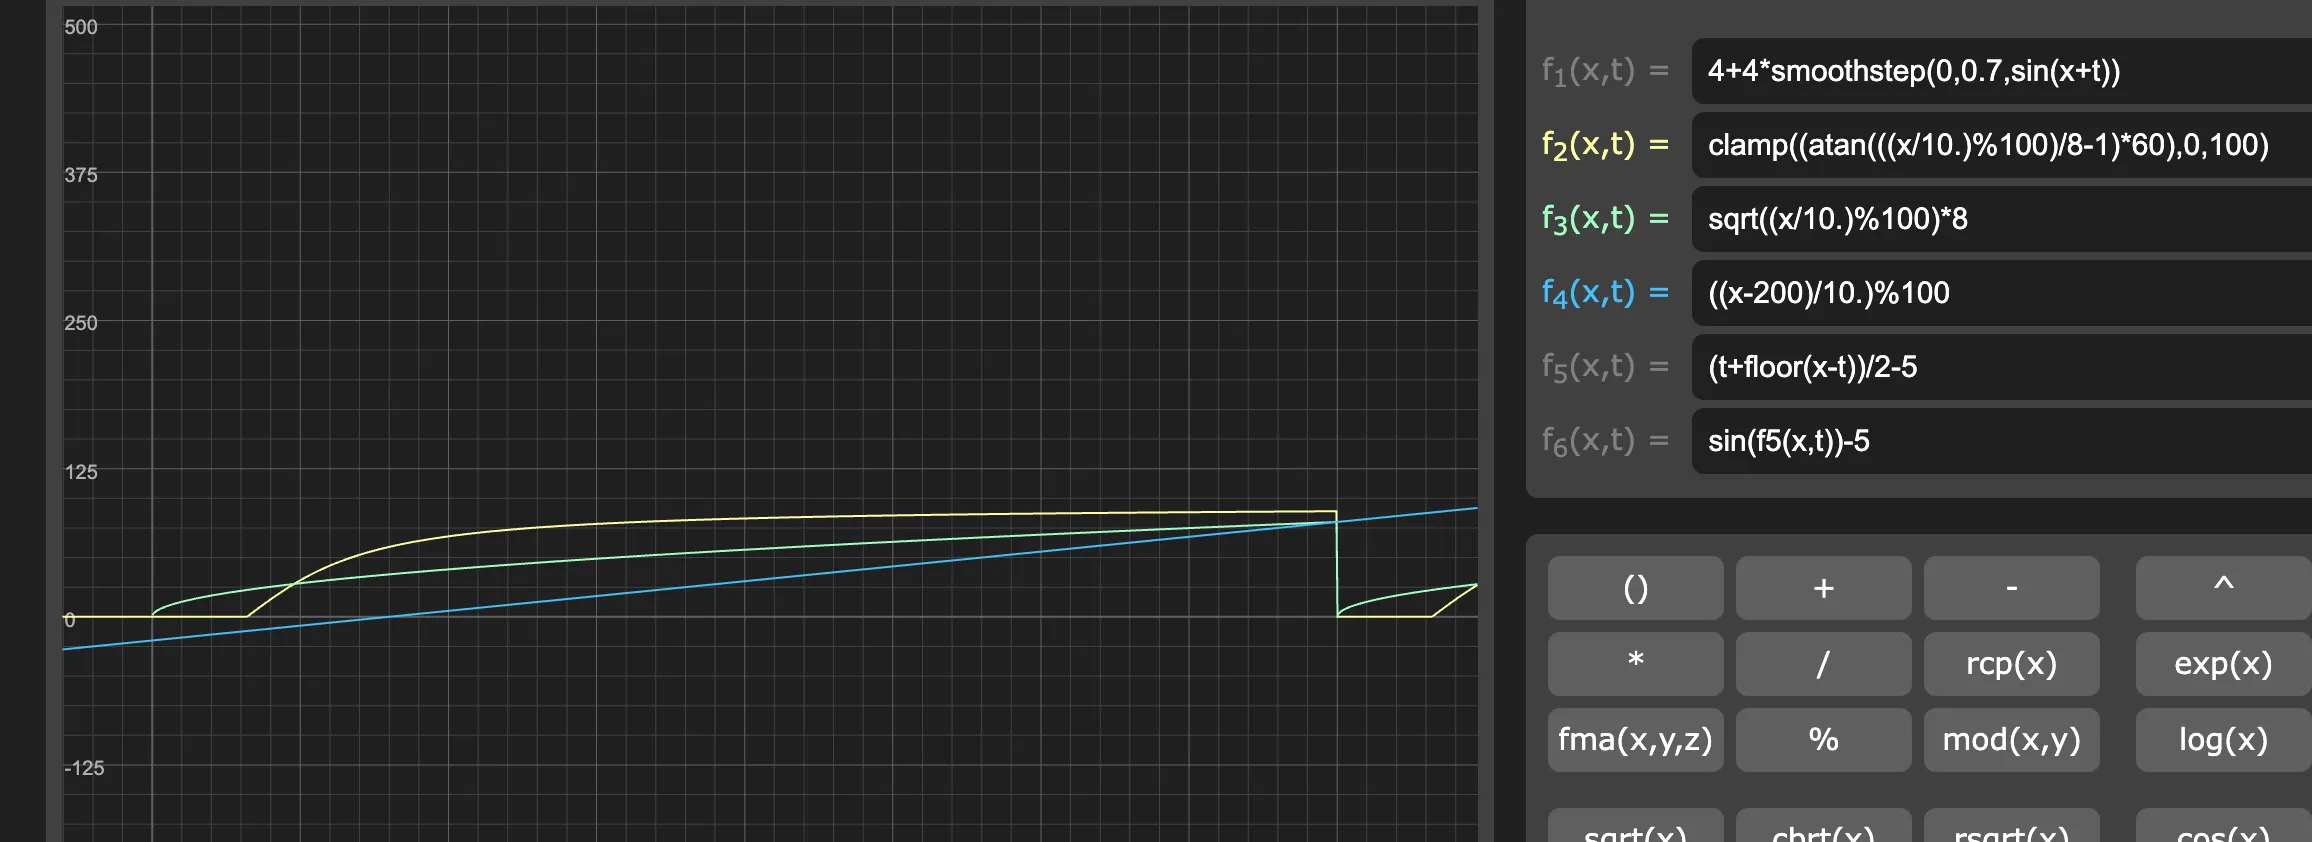
After that, other animations were created in a similar approach with different functions, using Graphtoy to test and visualise the motion path.
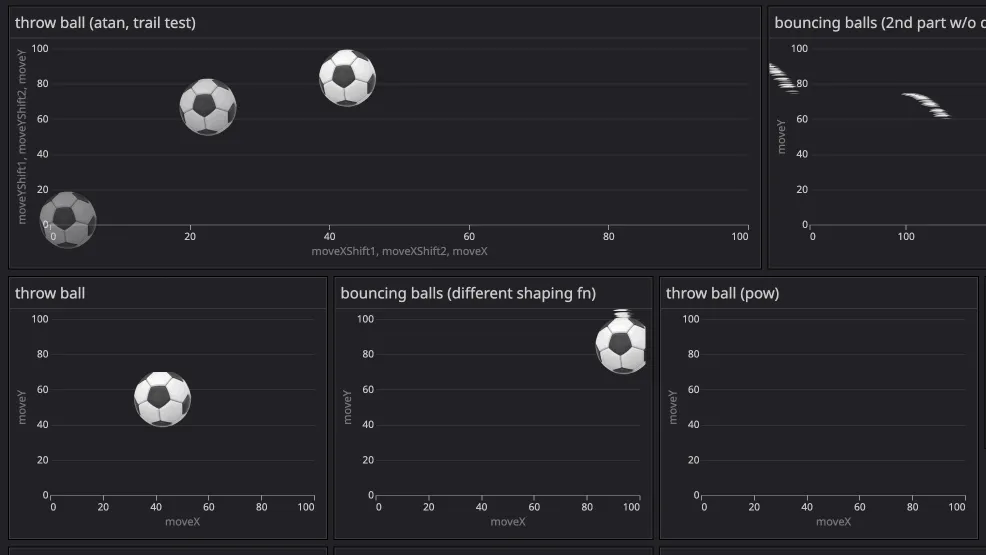
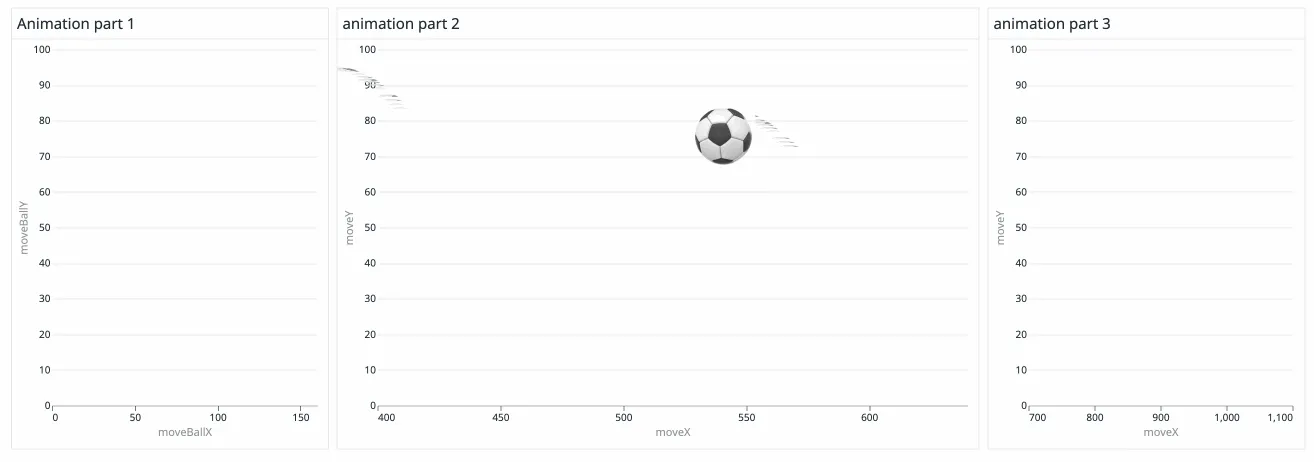
I also experimented with creating cross-graph animations, moving an object from one graph to another. I did this by having each graph renders a different segment of the animation’s X-axis. When loaded together, they appear as one continuous animation spread across panels. The effect only works if all graphs load simultaneously.
A color tool for Flame Graphs, 2025
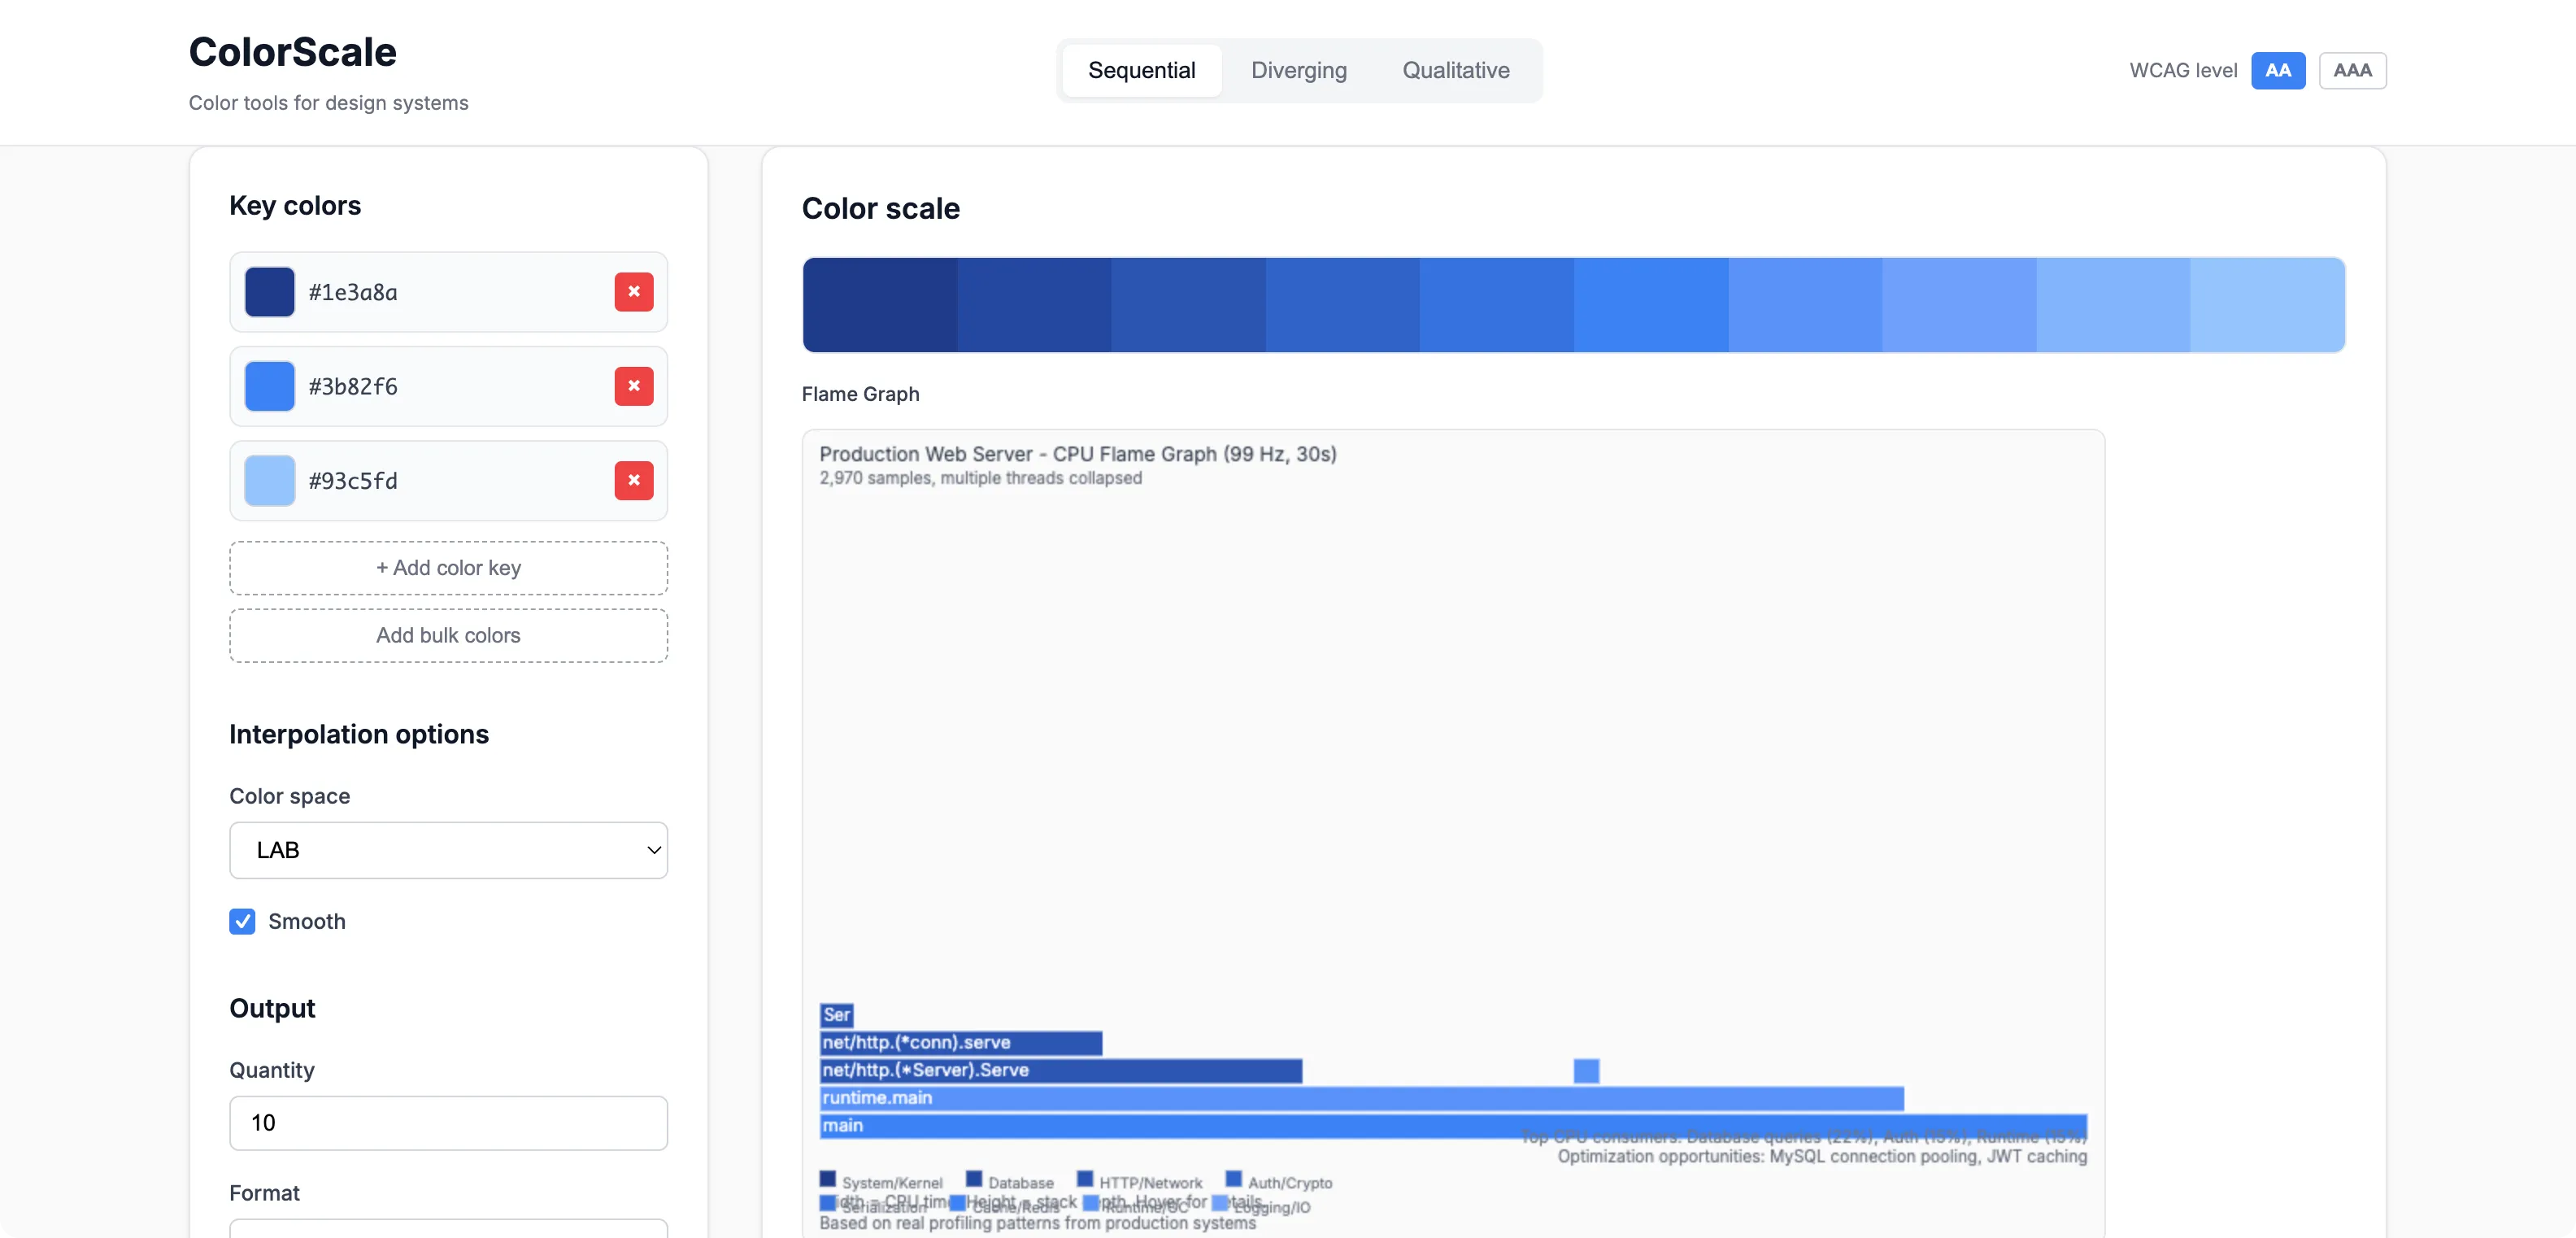
A small tool I built using Cursor to test colors for flame graphs, a visualization for stack traces of profiled software. The tool was based on Leonardo, an open source contrast-based color generator. However, it couldn’t generate the flame graphs very well, so I ended up testing the updated palette directly in our codebase.
Tools
Cursor
